/ Knowledge base /
How to create custom reportsHow to create custom reports
Here's how to get started:
1. Go to the Reports section in theMarketer and click on the ‘+Create Report' button.
This will open the report builder, where you can start customizing your data view.

2. On the top-left corner of the new report, click the editing icon to rename your report.
Choose a title that reflects its purpose, making it easier to identify later in the Reports dashboard.
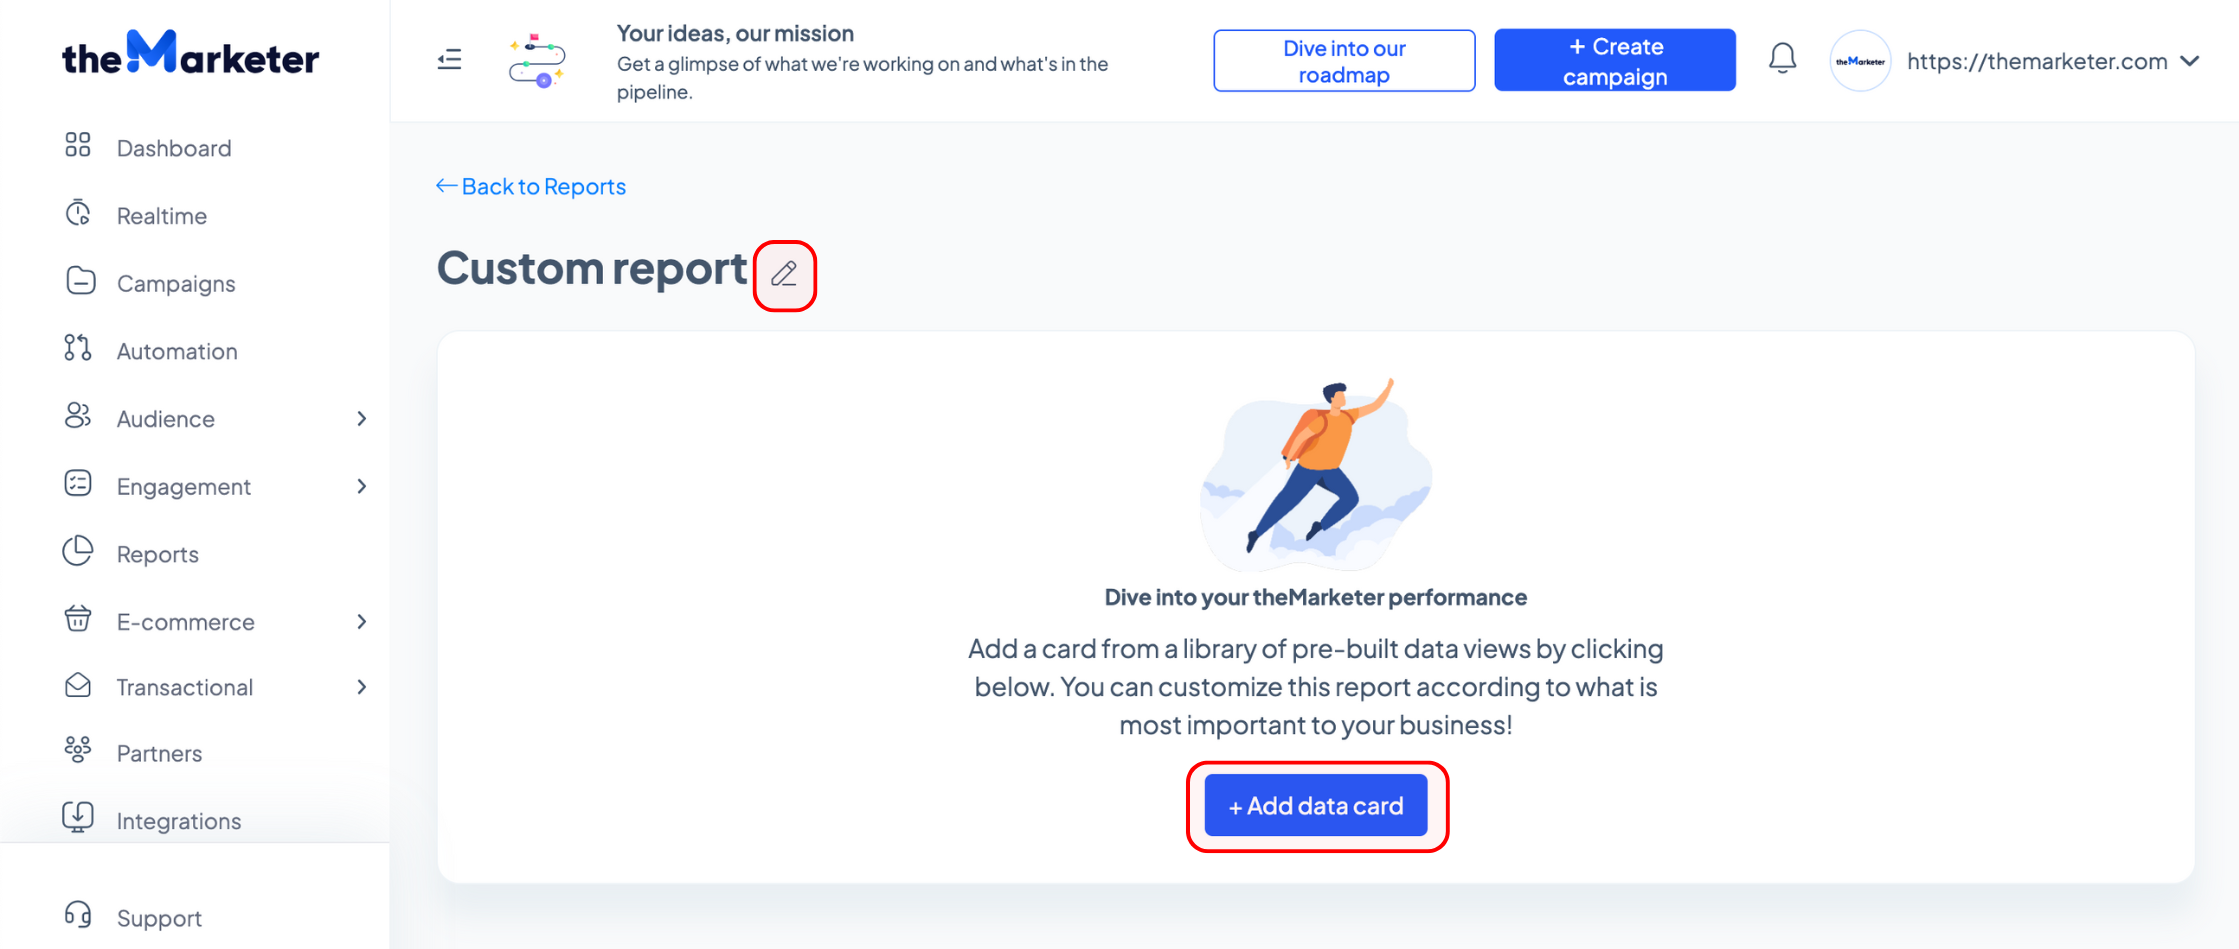
3. Click the +Add data card button to begin building your report.
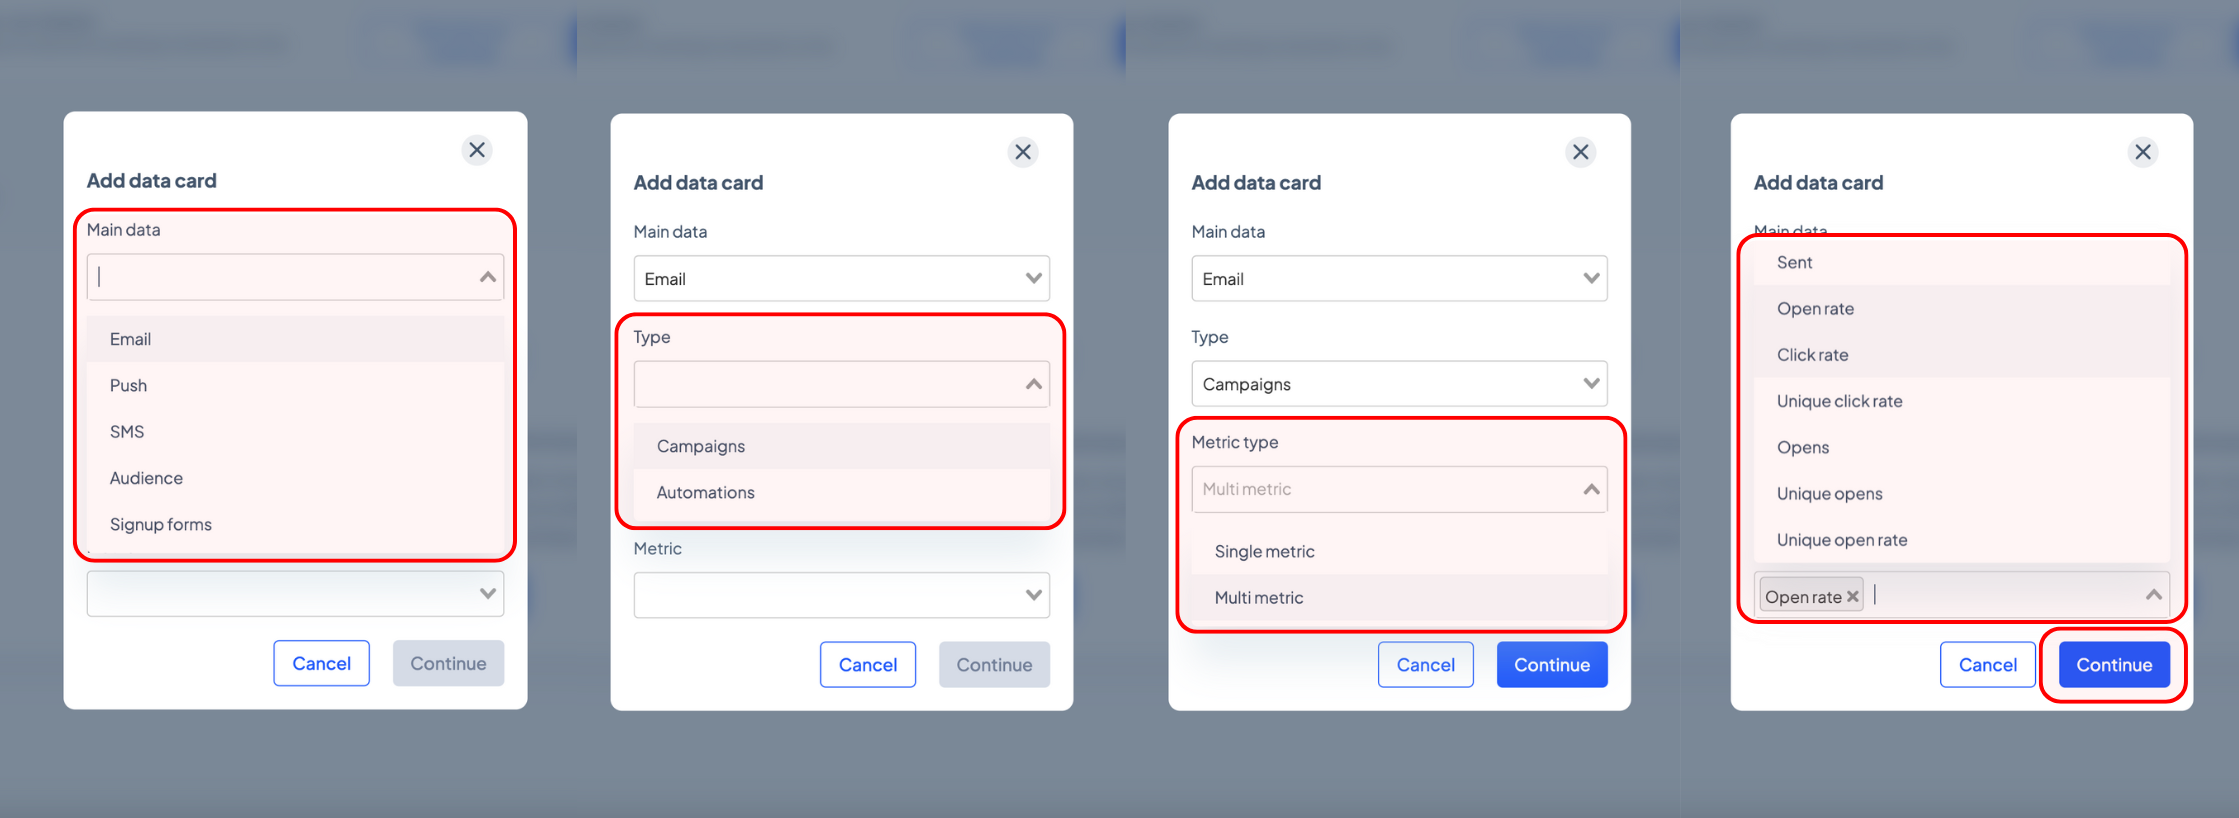
Use the dropdown menus to define the data you want to analyze:
- Main data: Select the primary category (e.g., Email, Audience, SMS, etc.).
- Type: Specify a subset of the main data.
- Metric type: Decide whether to display a Single metric or Multi metric. Multi metric allows you to plot multiple datasets on a single chart.
- Metric: Choose the specific metrics to display.
For example:
To analyze newsletter performance, select ‘Email’ under Main data, ‘Campaigns’ under Type, ‘Multi metric’ under Metric type, and then add ‘Open rate’ and ‘Click rate’ under Metrics.
To track unsubscribed contacts, choose ‘Audience’ under Main data, ‘Contacts’ under Type, ‘Single metric’ under Metric type, and ‘Unsubscribed emails’ under Metrics.
Please note that the options in each dropdown depend on the choices made in previous fields. Take your time to explore the combinations and once you’ve made your selection, click the ‘Continue’ button.
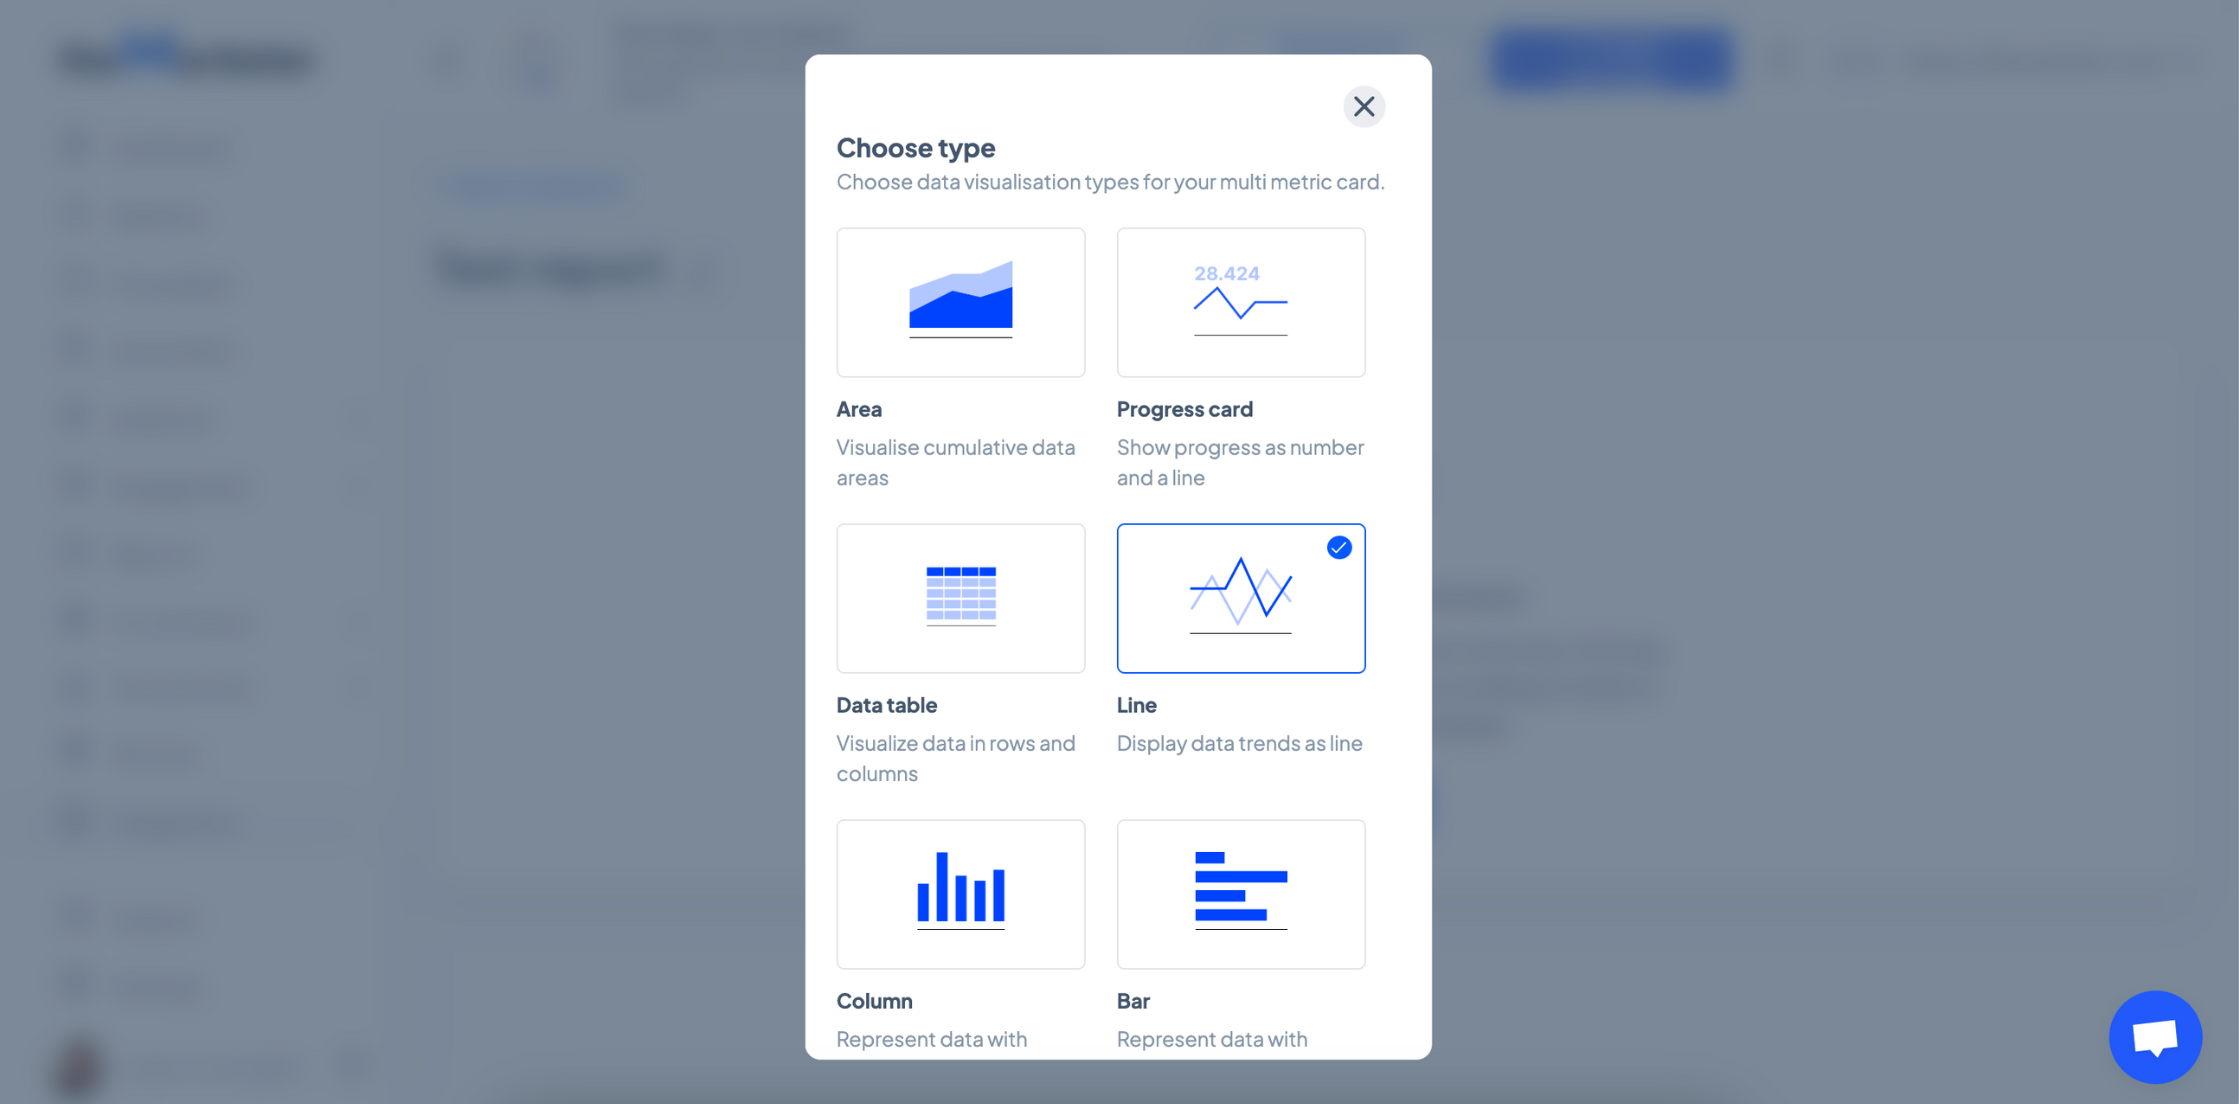
4. Select your preferred graph type to visualize the data.
theMarketer offers six visualization options, such as Line, Bar, and Column charts. Depending on the metric you’ve selected in the earlier steps, some graph types may not be available.
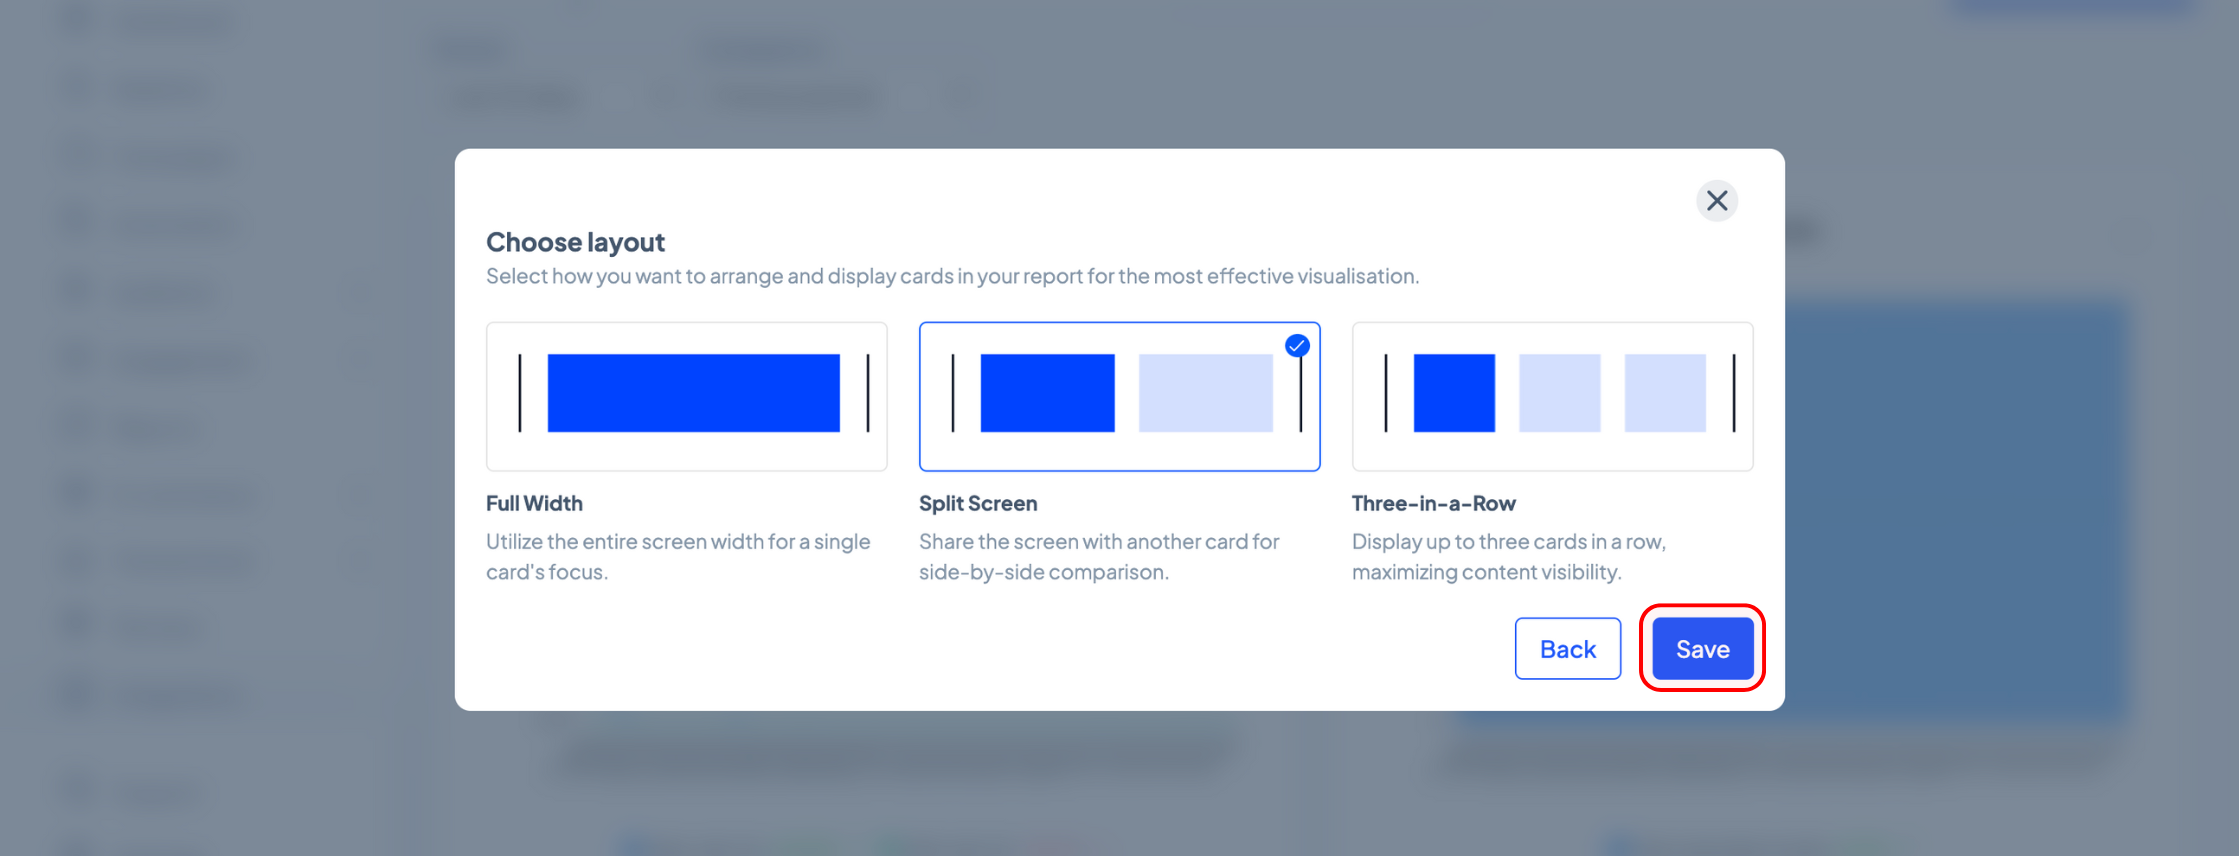
5. Choose the layout for your report.
Select ‘Full Width’ for a horizontal layout with detailed, expanded graphs. Or opt for the ‘Split Screen’ or ‘Three-in-a-Row’ layout to display multiple graphs side by side. To finalize your layout selection, click ‘Save’.
6. Refine and customize your report.
To rename your report, click the edit icon next to its name.
If you’ve chosen the Split Screen or Three-in-a-Row layouts, complete the row by clicking the ‘+Add card’ button for each additional graph. To expand the report with new graphs, use the ‘+Add card on new line’ button and repeat the setup process.
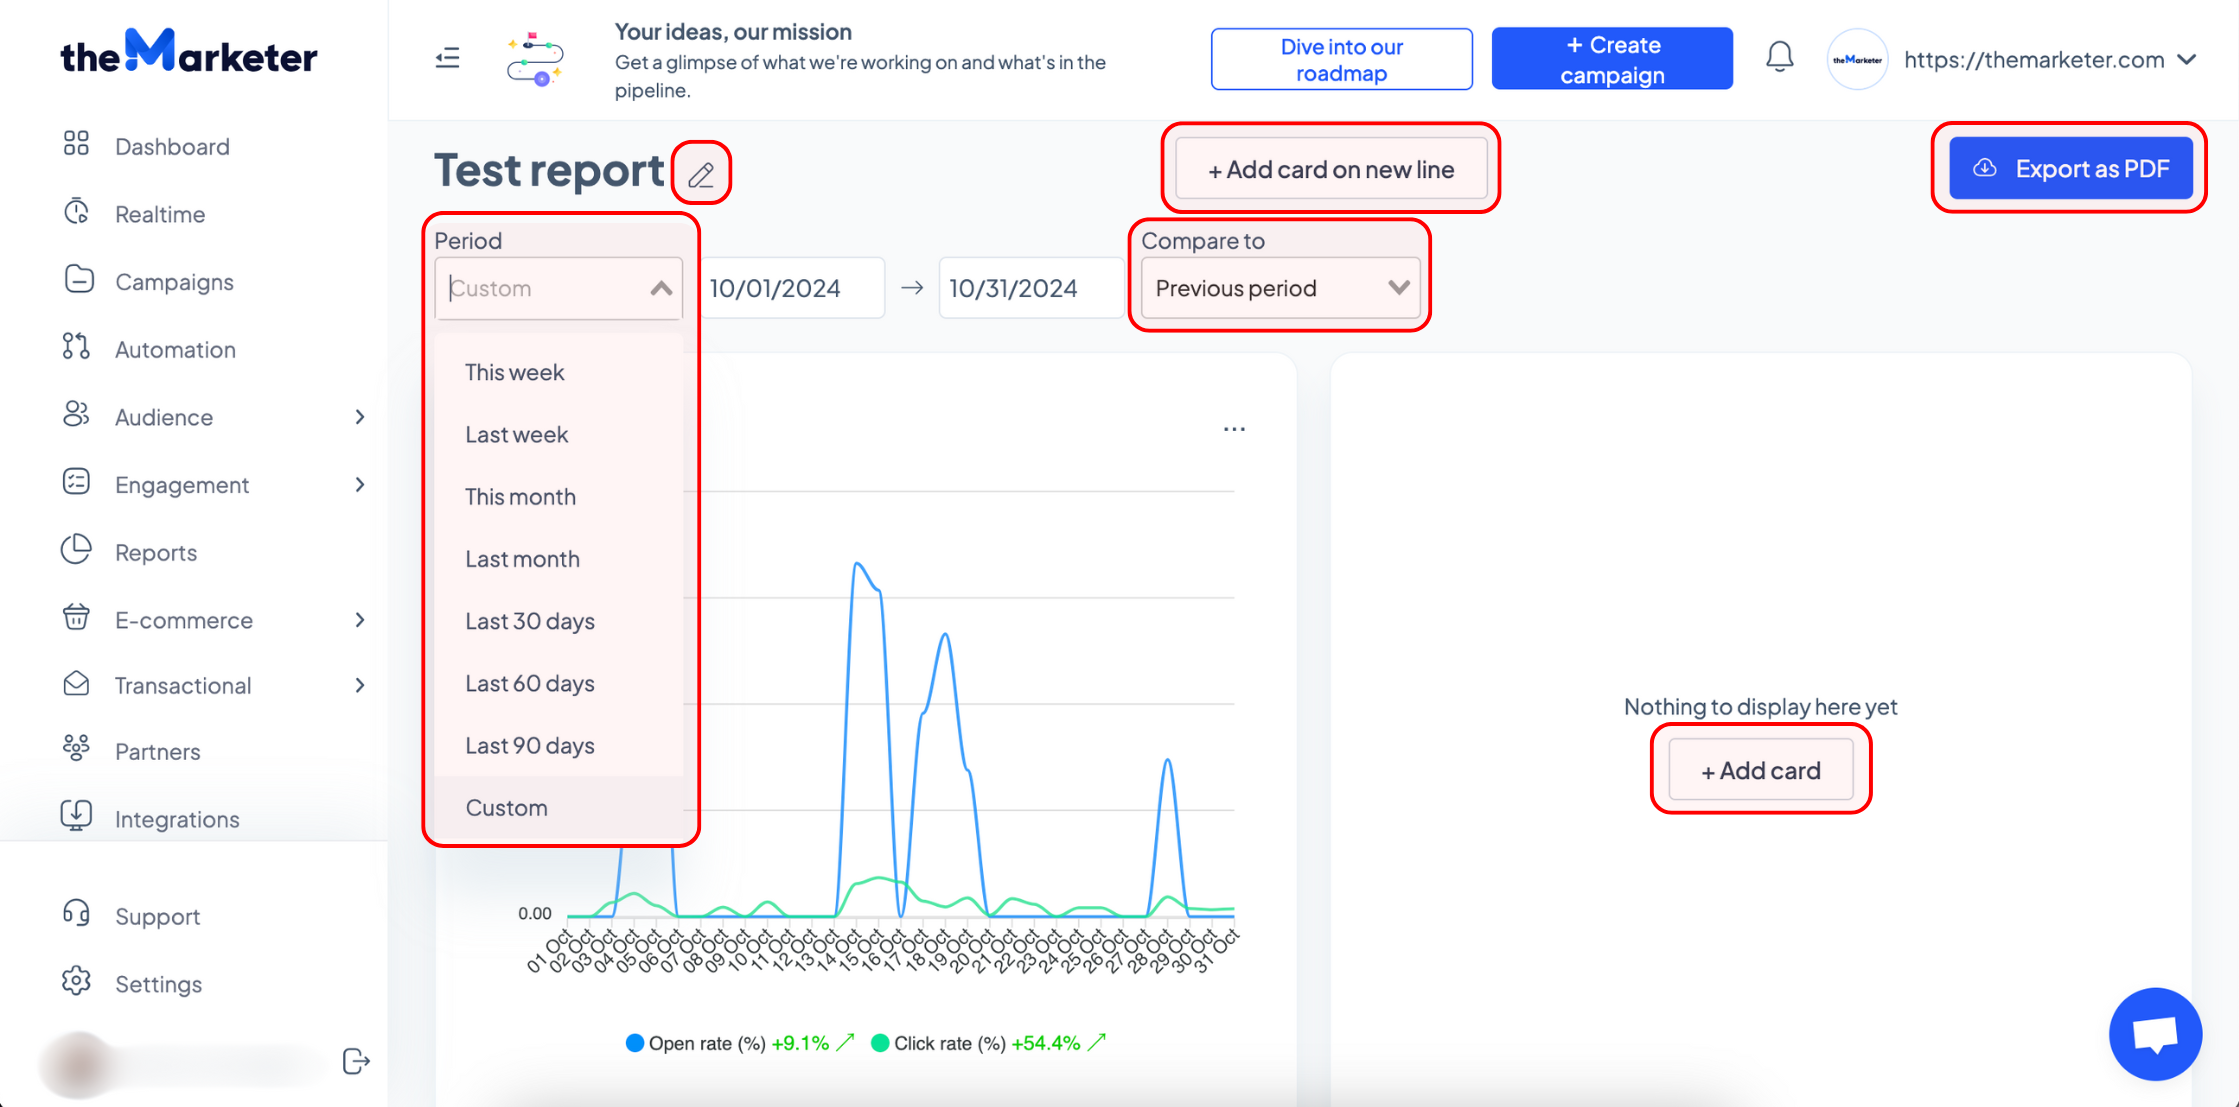
Once your report is complete, click the ‘Export as PDF’ button, then confirm your choice in the dialogue box that appears by clicking ‘Export’.

7. Manage your custom reports
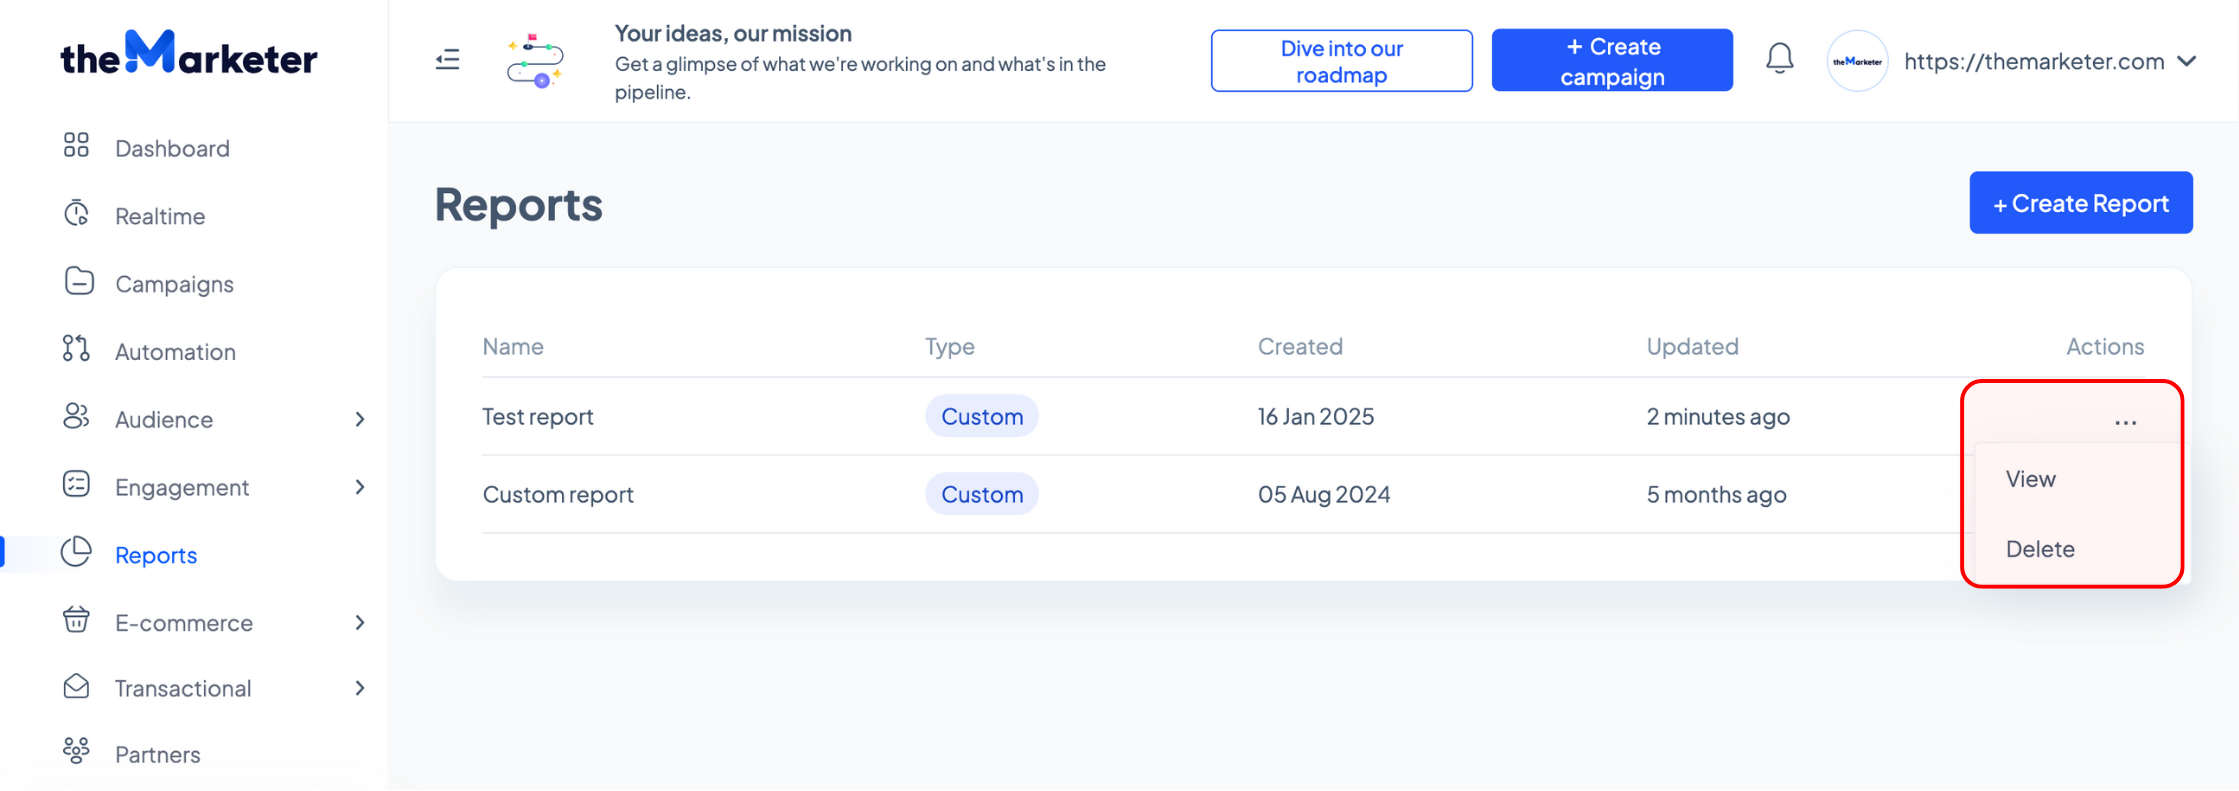
In the Reports dashboard, you’ll find a list of all your custom reports.
To view or make changes to a report, click the three-dot menu in the Actions column and select ‘View’. To delete a report you no longer need, select ‘Delete’ from the same menu.
With theMarketer’s custom reporting tools, you can gain actionable insights and optimize your marketing strategy effortlessly. If you need further assistance or have suggestions for new features, our team is here to help!
Related articles
STILL HAVE QUESTIONS?